| Home |
| PICO C Interpreter with FSS Extensions |
| MENU - System Utility Menu |
| DABR - Direct Asscess File Browser |
| SYS-Stat - System Status |
| Downloads |
System Status and Information
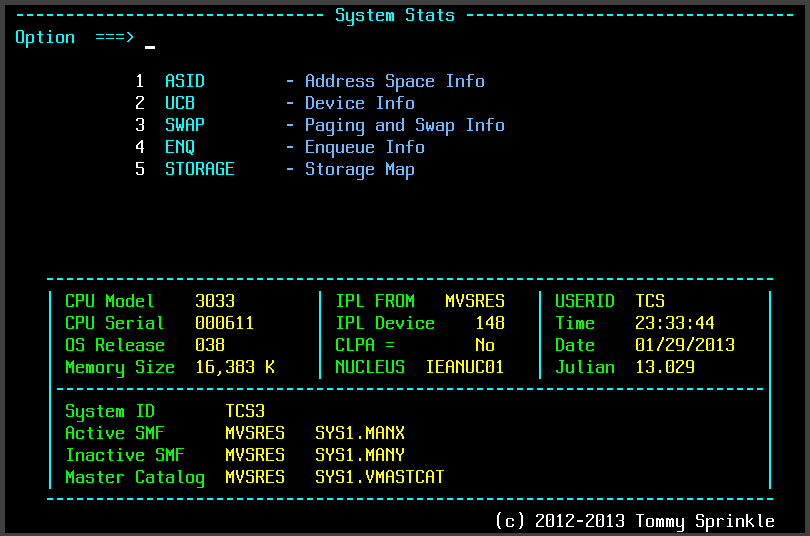
This utility will display various status and information about the MVS operating system. There are several sub-panels in this utility.
The main panel displays some IPL and SMF related infomration as well as the current date and time.
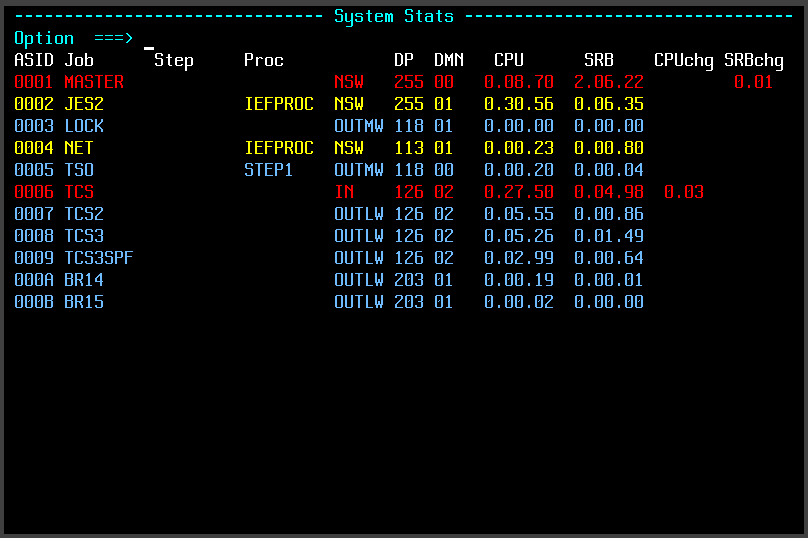
The Address Space Info panel displays information about active address spaces. There is one line for each active address space.
Information displayed is: the ASID (address space id), Job Name, Step Name and Proc-Step Name, Swap Status, Dispatching Priority, Domain, Total CPU Time, Total SRB Time, Delta CPU Time, and Delta SRB Time.
Lines are color coded with Blue used for swapped out address spaces, Yellow for non-swapable address spaces, and Red for any address space that has a CPU or SRB delta time that is not zero.
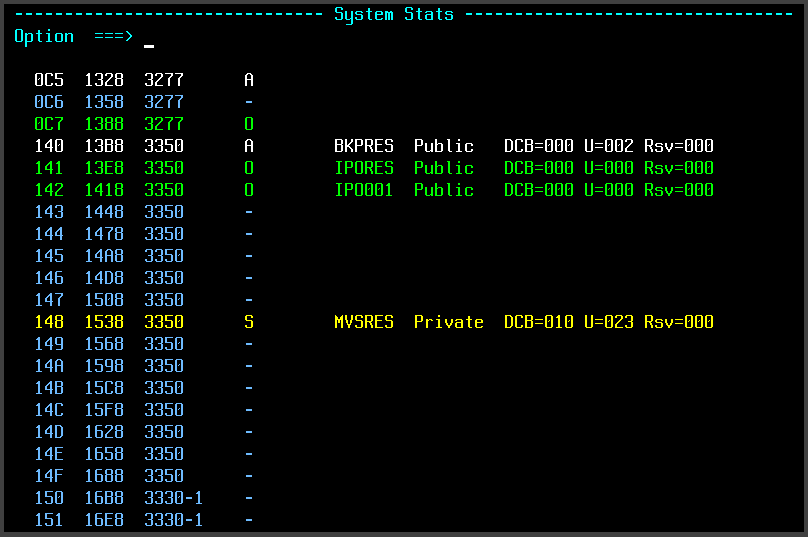
The UCB Device panel displays information about I/O devices from the UCB (Unit Control Block) table. UCBs are defined at sysgen time. They represent a device defined to MVS, which may or may not actually be physically connected to the CPU. One line is displayed for each UCB.
The information dispalayed is: Device Address (CUA - Channel and Unit Address), the address of the UCB in memory, the device type, the device status (A - allocated, O - online, not allocated, S - system IPL device or system console, "-" - offline) and N-RDY if not ready, Volume Serial of the media mounted on the device, the volume use attributes, the number of open DCBs, the number of users, and the number of reserves.
Lines are color coded with Blue used for offline devices, Green for online but not allocated, White for online and allocated, and Yellow for system devices.
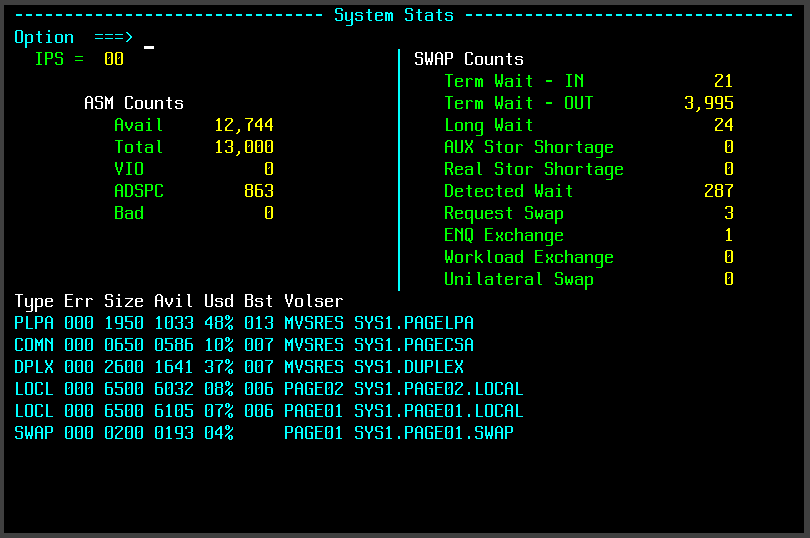
The Paging and Swap panel displays various information about Virtual Storage Slots, Swap Counts, and Paging and Swap data sets.
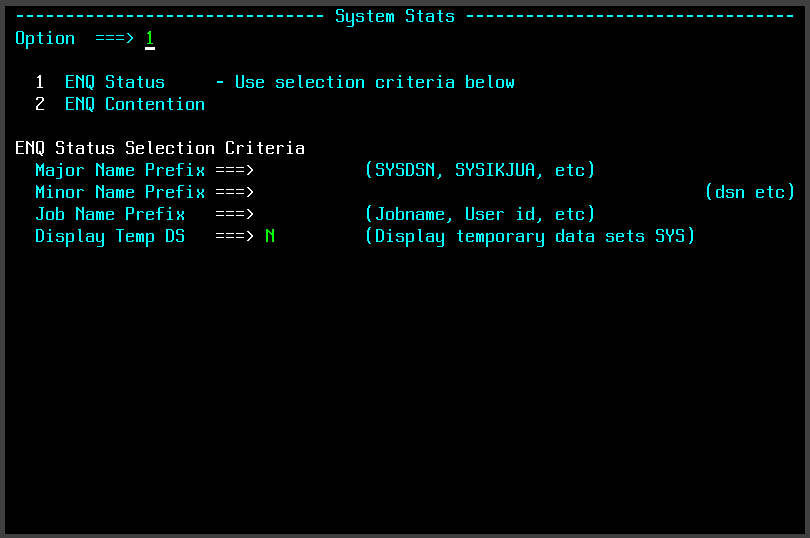
The System ENQ panel is used to display enqueue status. One of two types of displays may be selected. The first displays information about all enqueues and the second displays only enqueue contention status.
Results for all enqueues may be filtered by specifying any combination of the following: Enqueue Major Name, Minor Name, Job Name holding the enqueue. Each of these is interpreted as a prefix. In addition enqueues for temporary data sets may also be excluded.
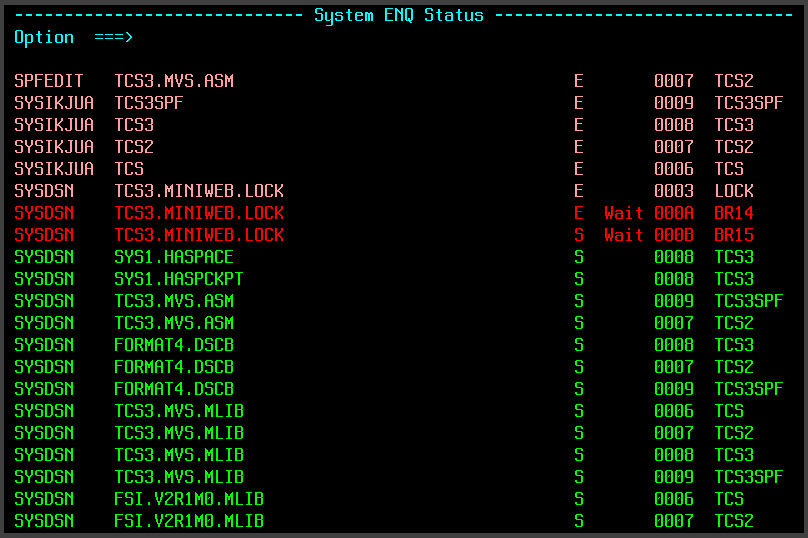
One line for each active enqueue is displayed containing Enq Major Name, Enq Minor Name, Exclusive/Shared indicator, Waiting status, ASID, and Jobname.
Lines are color coded with Green used for shared enqueues, Pink for exclusive enqueues, and Red for waiting.
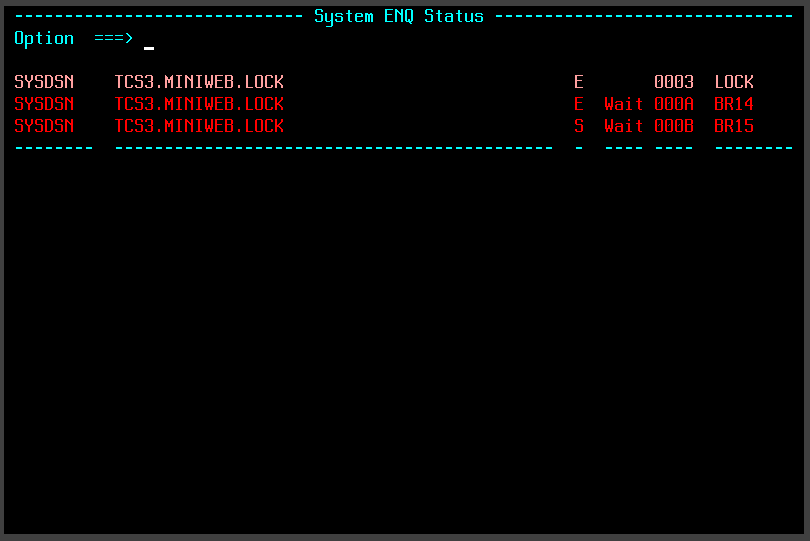
The Enq Contention display only shows enqueue status related to waiting requests.
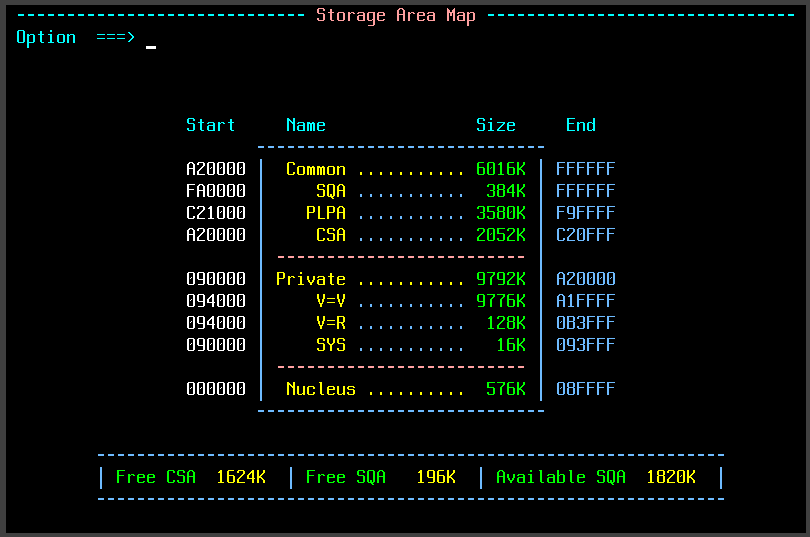
The Storage Map panel displays a map of virtual storage locations and a summary of CSA (Common Storage) usage.